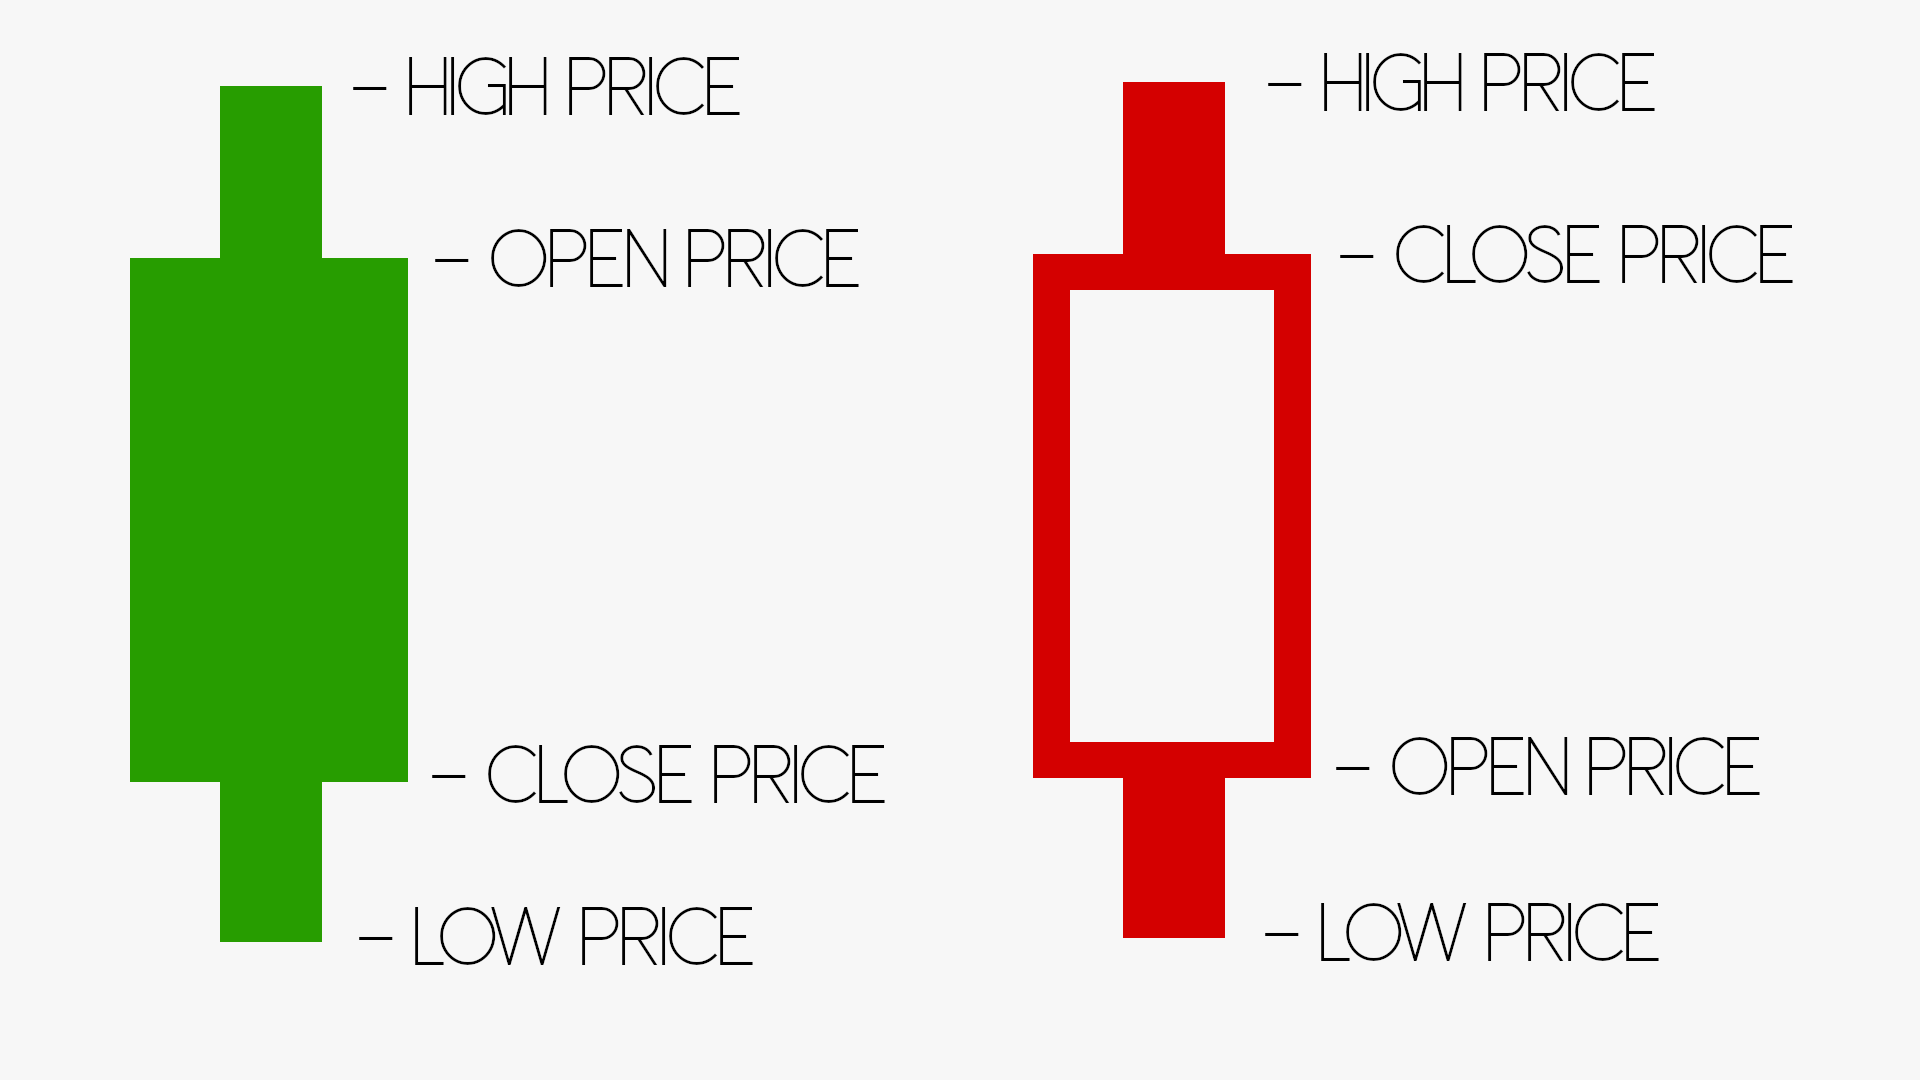
There are various types of candlestick models. Today, we will look at the four main models and the most popular ones: Standard Candlestick Chart, Heikin Ashi, Renko, and Kagi. Why is it important to know the difference? Why is it important to choose the right candlestick model?

1. Standard Candlestick Chart
Definition:
The candlestick chart is a visualisation of price movements of assets over a specific time period.
Each candlestick contains four key price values:
- Open (opening price)
- High (highest price)
- Low (lowest price)
- Close (closing price)

Area of application:
This model is universal and is used across all time frames—from minutes to months. It is suitable for both beginners and experienced traders.
Advantages:
- Provides a complete picture of price movement for the selected period.
- Widely used and easy to read.
Disadvantages:
- High volatility can complicate analysis, especially in short-term trading.
- Not optimal for identifying long-term trends.

2. Heikin Ashi
Definition:
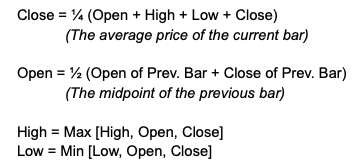
Heikin Ashi is an advanced type of chart that smooths price movements through averages. This approach helps to more easily identify trends by eliminating some of the random market fluctuations. Here is the formula by which it is calculated:

Area of application:
Primarily used for analyzing long-term trends. It is popular among traders who focus on trends and avoid frequently opening and closing positions.
Advantages:
- Reduces visual “noise,” clarifying trend patterns.
- Facilitates the recognition of trend periods or reversals.
Disadvantages:
- Does not show the exact opening and closing prices.
- Delays in signals for trend changes.

3. Renko
Definition:
Renko charts are based on price movement rather than time. They are built from “bricks” that appear when the price reaches a certain range (e.g., $10, $20, or a specific percentage).
Area of application:
Ideal for long-term analysis, they are preferred by traders looking to avoid market “noise.”
Advantages:
- Clean visualization of sustained trends.
- Ignores random price fluctuations.
Disadvantages:
- Does not account for the time taken to reach a given trend.
- Misses short-term trading opportunities.

4. Kagi
Definition:
Kagi charts reflect price movement using lines that change thickness or direction depending on price movement. Traditionally, lines were thick or thin to indicate upward and downward trends. Today, lines are usually of the same size but use colors—green for upward trends and red for downward.
Area of application:
Suitable for identifying key levels of support and resistance as well as confirming trends.
Advantages:
- Clearly defines trends and reversal levels.
- Reduces noise and facilitates analysis of long-term trends.
Disadvantages:
- Does not represent the timing of the movement.
- Reversal signals can be delayed.

Conclusion
Why is it important to know the difference?
Each candlestick model provides a unique perspective on market movements. The differences among them allow traders to choose the most suitable tool for their goals. For instance:
- Candlestick Chart provides a detailed and realistic view for short-term trading.
- Heikin Ashi and Renko eliminate noise and are suitable for trend analysis.
- Kagi is indispensable for identifying support and resistance levels.
Why is it important to choose the right model?
Choosing the appropriate candlestick model can significantly enhance the effectiveness of analysis, minimize risk, and provide a clear strategy for making informed decisions.
*This article is for educational and informational purposes only. The information presented should not be construed as financial advice. It is advisable to consult certified financial experts before undertaking any investment actions.